
Intune is a cloud-based service that allows you to manage and secure your organization’s devices, apps, and data. It also provides you with insights and analytics to help you improve your device management strategy and troubleshoot issues. In this blog post, we will show you how to monitor and report on Intune performance and usage using the following tools:
- The Intune dashboard
- The Intune reporting blade
- The Intune Data Warehouse
- The Intune Graph API
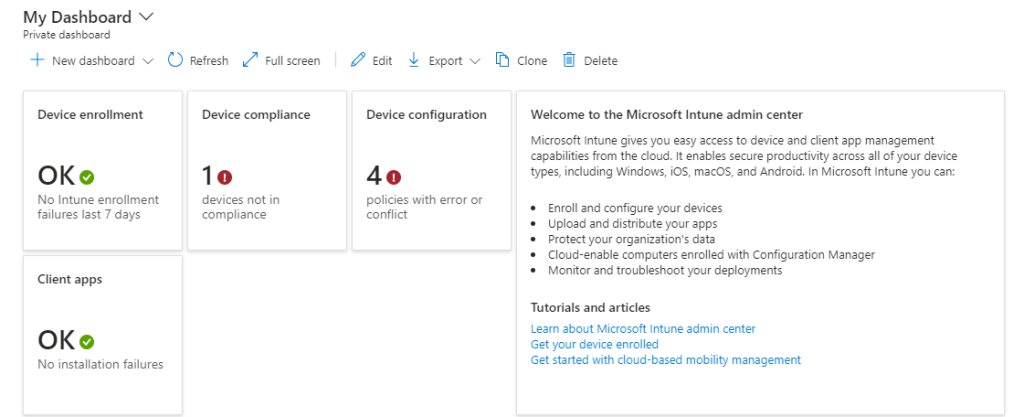
The Intune dashboard
The Intune dashboard is the main interface for viewing the status and health of your Intune environment. It displays key metrics and indicators such as device compliance, app protection, device configuration, and enrollment. You can also access alerts, notifications, and recommendations from the dashboard. The dashboard is updated every 15 minutes and can be customized to show the data that is most relevant to you.
To access the Intune dashboard, sign in to the Microsoft Endpoint Manager admin center and select Devices > Overview. You can also use the search box to find specific devices, users, or groups. You can filter, sort, and export the data in the dashboard to create your own reports. You can also pin the dashboard to your home page for easy access.
The Intune reporting blade
The Intune reporting blade is a collection of built-in reports that provide detailed information about various aspects of your Intune deployment. You can use these reports to analyze trends, identify issues, and compare data across different time periods. The reports are grouped into the following categories:
- Device management
- App management
- Endpoint security
- Enrollment and compliance
- Operational and audit logs
To access the Intune reporting blade, sign in to the Microsoft Endpoint Manager admin center and select Reports > All reports. You can also use the search box to find specific reports. You can filter, sort, and export the data in the reports to create your own reports. You can also pin the reports to your home page for easy access.
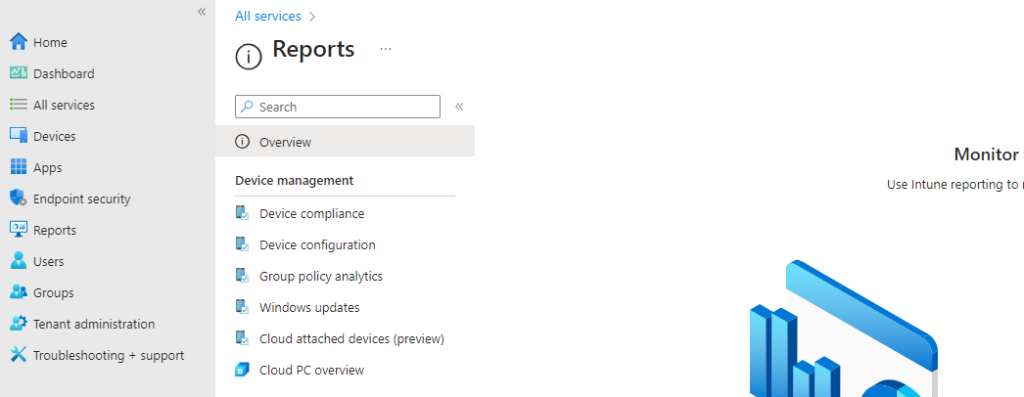
Direct access here: Reports – Microsoft Intune admin center
The Intune Data Warehouse
The Intune Data Warehouse is a cloud-based service that provides historical data and analytics for your Intune deployment. You can use the Intune Data Warehouse to create custom reports and dashboards using tools such as Power BI, Excel, or your own business intelligence solution. The Intune Data Warehouse provides data on device inventory, configuration, compliance, app inventory, app usage, app protection, and audit events. The data is updated daily and can be accessed via an OData feed or a REST API.
To access the Intune Data Warehouse, sign in to the Microsoft Endpoint Manager admin center and select Reports > Data Warehouse. You can also use the Intune Data Warehouse app for Power BI to connect to the data and create interactive reports and dashboards. You can also use the Intune Data Warehouse documentation to learn how to use the OData feed or the REST API to access the data.
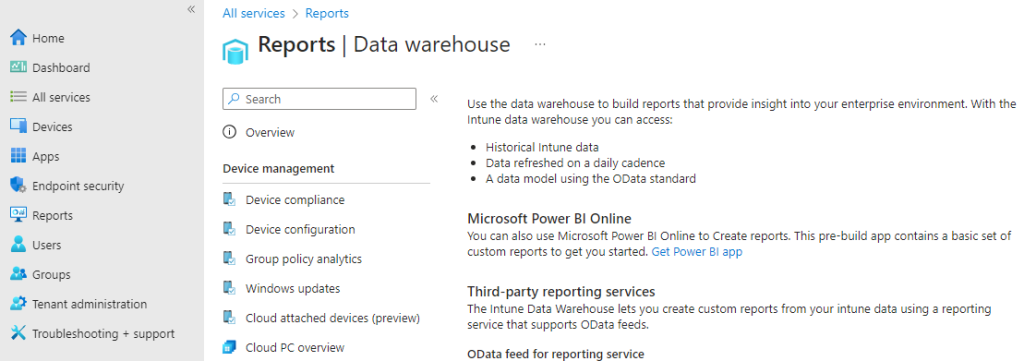
Direct access here: Reports – Microsoft Intune admin center
The Intune Graph API
The Intune Graph API is a web service that allows you to programmatically access and manipulate data in your Intune environment. You can use the Intune Graph API to perform tasks such as creating, updating, deleting, or querying devices, users, groups, policies, apps, and reports. You can also use the Intune Graph API to automate workflows, integrate with other services, and customize your Intune experience. The Intune Graph API is based on the Microsoft Graph API, which provides a unified interface for accessing data across Microsoft 365 services.
To access the Intune Graph API, you need to register an app in Azure AD and grant it the appropriate permissions. You can then use any HTTP client or SDK to send requests and receive responses from the Intune Graph API. You can also use the Graph Explorer tool to test and explore the Intune Graph API. You can also use the Intune Graph API documentation to learn how to use the Intune Graph API.
What’s Intune Graph API –> Working with Intune in Microsoft Graph – Microsoft Graph v1.0 | Microsoft Learn
We hope this blog post has given you an overview of how to monitor and report on Intune performance and usage. By using these tools, you can gain valuable insights and optimize your Intune deployment. If you have any questions or feedback, please let us know in the comments below.
One Reply to “How to Monitor and Report on Intune Performance and Usage”
Comments are closed.